Financial Dashboard Software Solutions
Dynamic Financial Dashboards Power Your Decisions Instantly
- Instant Insights – Get up-to-the-minute financial data with automated updates that ensure your decisions are based on the latest information.
- Tailored Views – Customize your dashboards with drag-and-drop simplicity, tailoring visuals to your needs and preferences for clearer analysis.
- Seamless Integration – Seamless integration with your financial systems to consolidate data from multiple sources into one cohesive dashboard.
We Connect to 200+ ERPs/EPMs


See What Dashboard Tools Work for Your ERP
Operational Reporting for Oracle EBS and OCA
Angles Enterprise for Oracle unlocks powerful insights in your chosen BI tool. 1,800 pre-built, no-code business reports deliver actionable insights.
Operational Reporting for SAP ECC and S/4HANA
Angles Enterprise for SAP transforms critical operational data into actionable insights, with 600+ calculated fields enriching your supply chain data.
Operational Reporting and Distribution
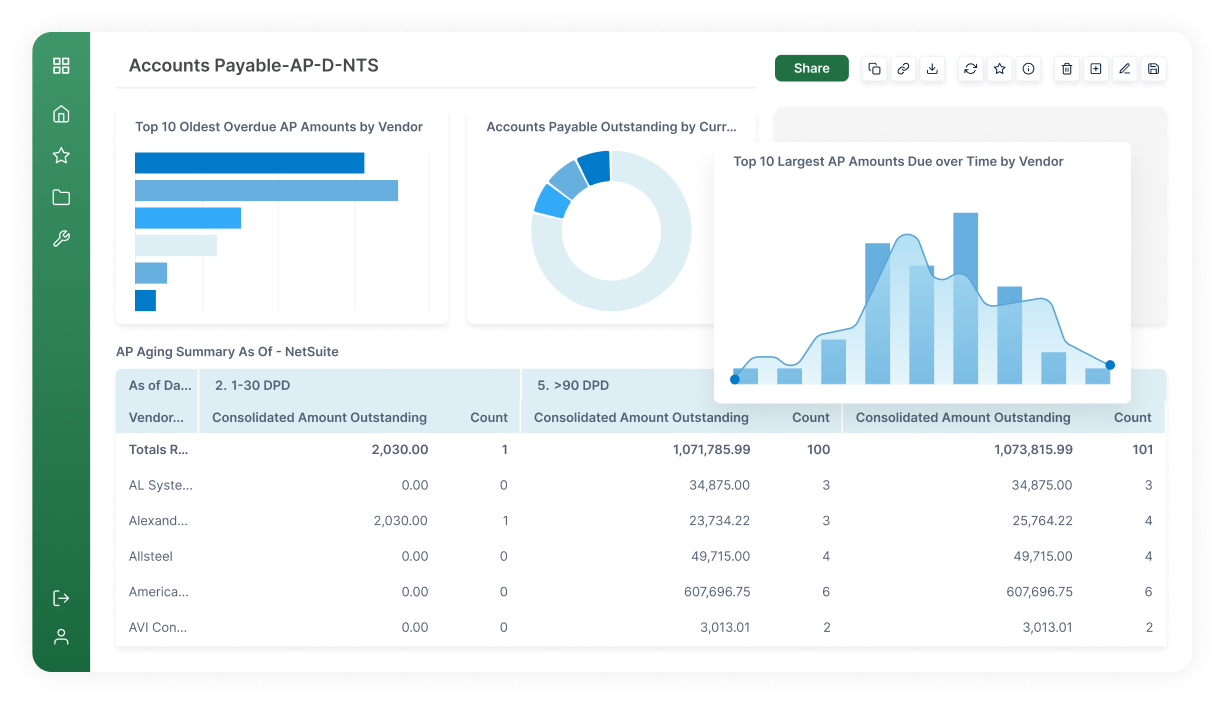
Angles Professional streamlines the creation and distribution of operational insights with pre-built content for Deltek, NetSuite, Oracle EBS/Fusion Cloud ERP.
Reporting for Microsoft Dynamics 365 F&SCM and AX
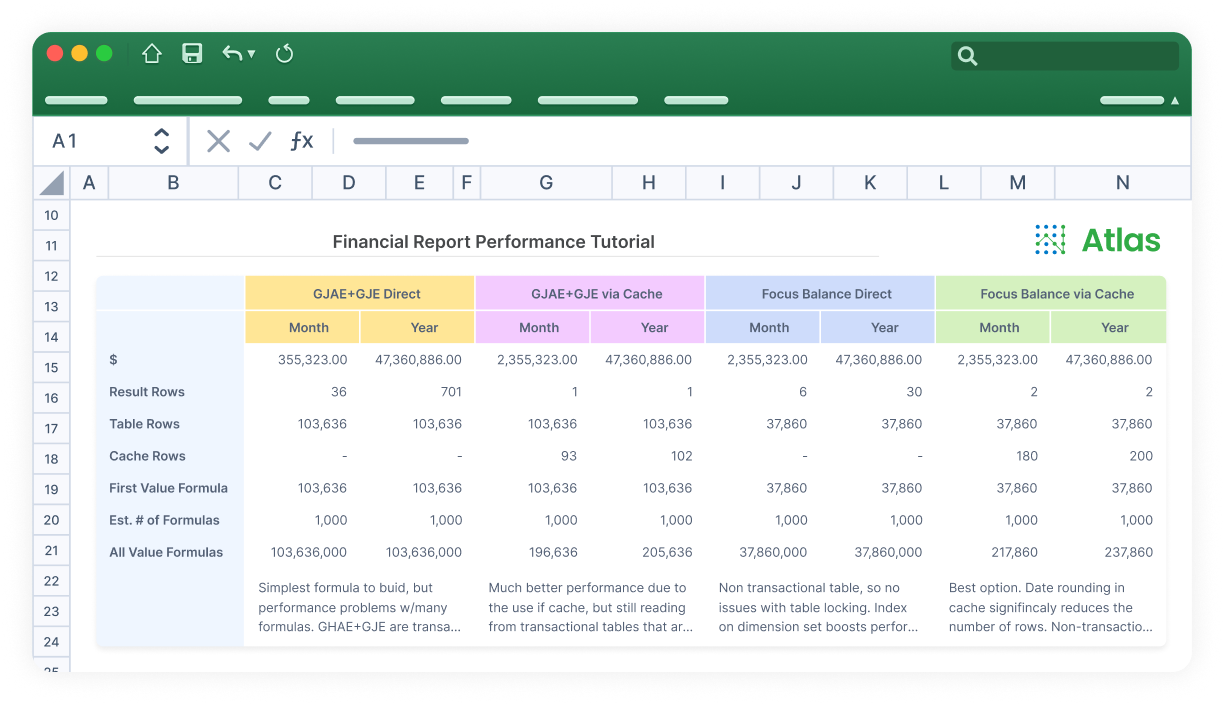
Atlas is an easy-to-use financial reporting solution with out-of-the-box templates to get you up and running immediately or customize to your needs.
Budgeting & Planning
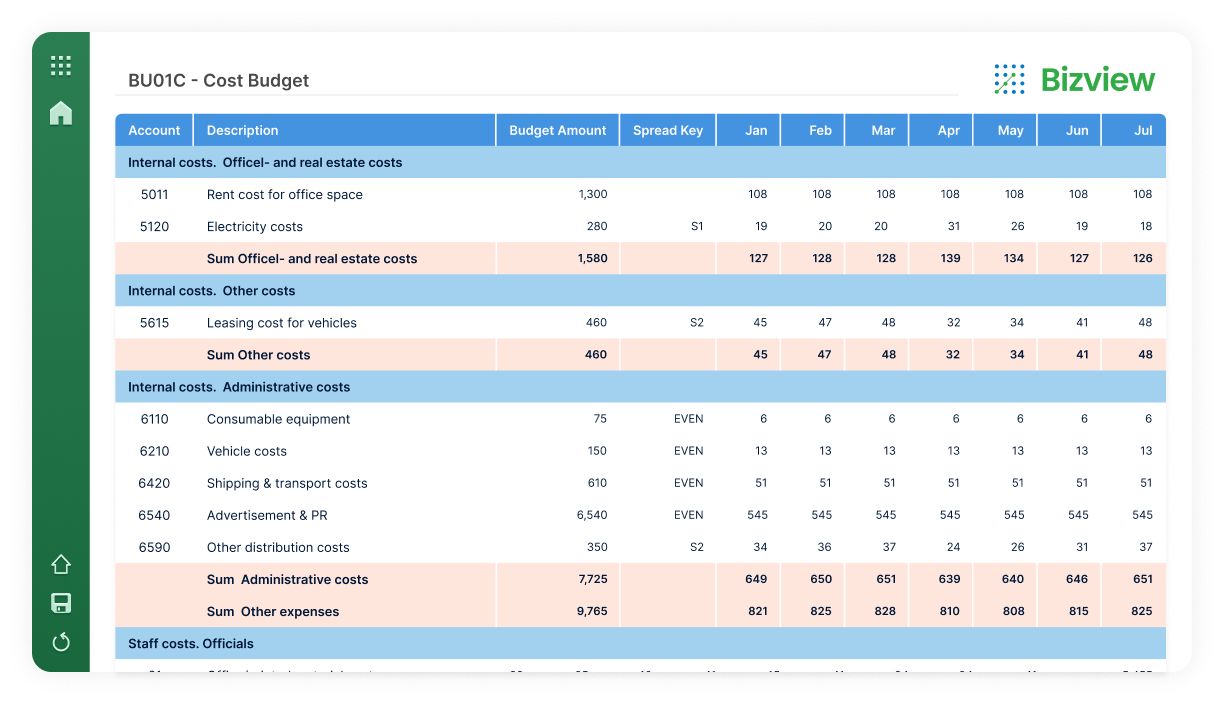
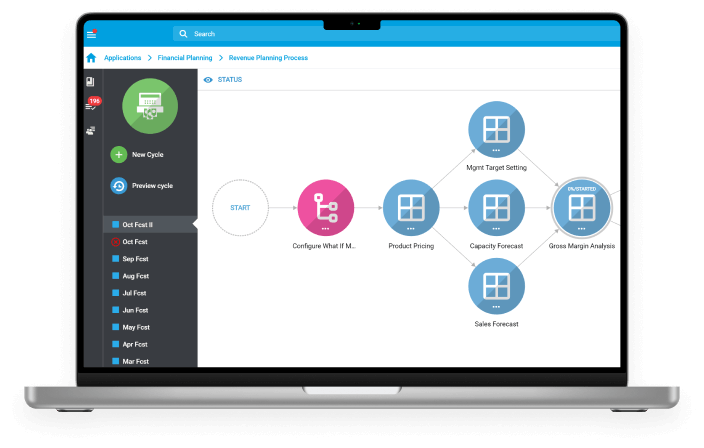
Budgeting & Planning: Bizview is an integrated and scalable web-based budgeting, planning, and forecasting solution.
Budgeting & Planning in ANZ
Calumo is an automated reporting, planning, and budgeting to enhance performance management with extended planning and analysis.
Web Reporting for JD Edwards and Oracle EBS
Hubble shrinks close processes by up to 50% with real-time reporting, automated report distribution, and transaction drill-down capabilities.
Data Warehouse Automation for Microsoft Dynamics
Jet Analytics is a complete data preparation, automation, and modeling solution. It’s five times faster than hand coded solutions.
Reporting for Microsoft Dynamics BC, NAV, and GP
Jet Reports offers flexible reporting in Excel and on the web. It allows non-technical users to build reports and dashboards.
Business Intelligence & Analytics
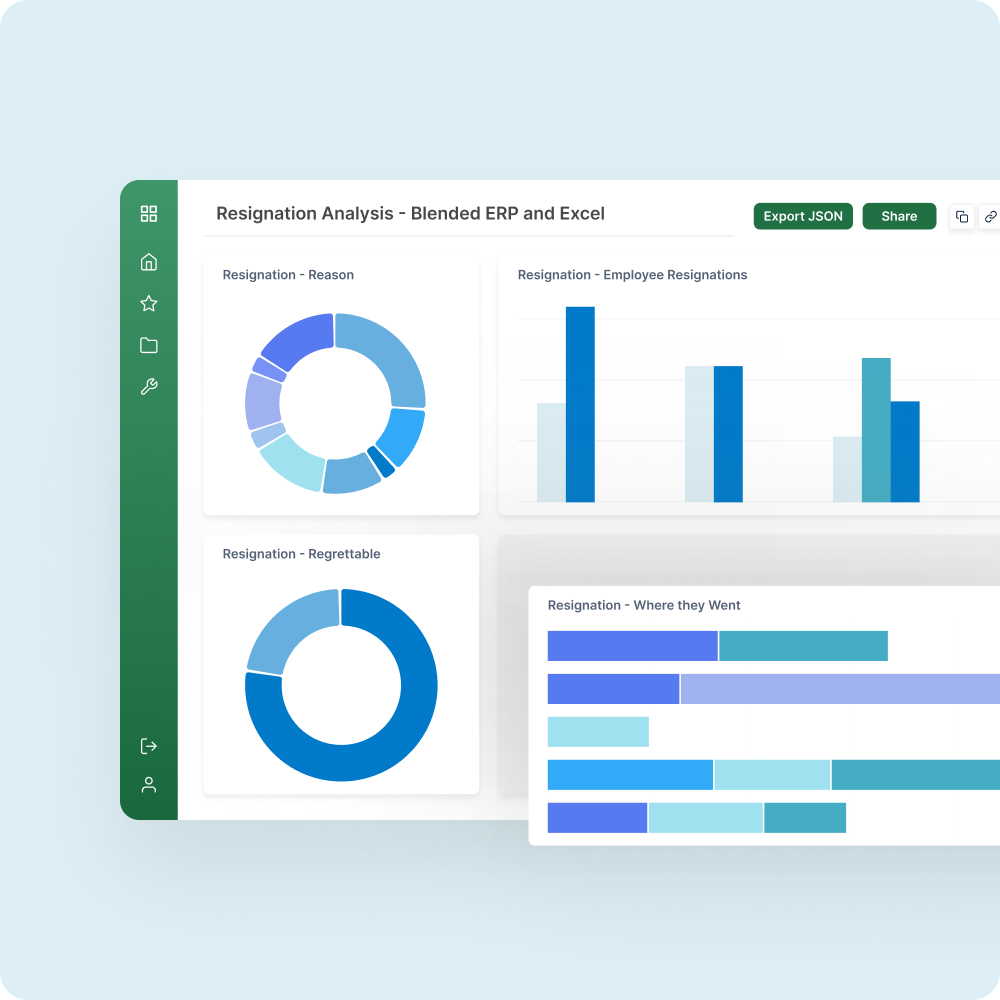
Logi Symphony is modern BI software that allows software vendors and enterprises to augment any application with AI-infused analytics
Excel-based Reporting for Viewpoint, Yardi, Sage & More
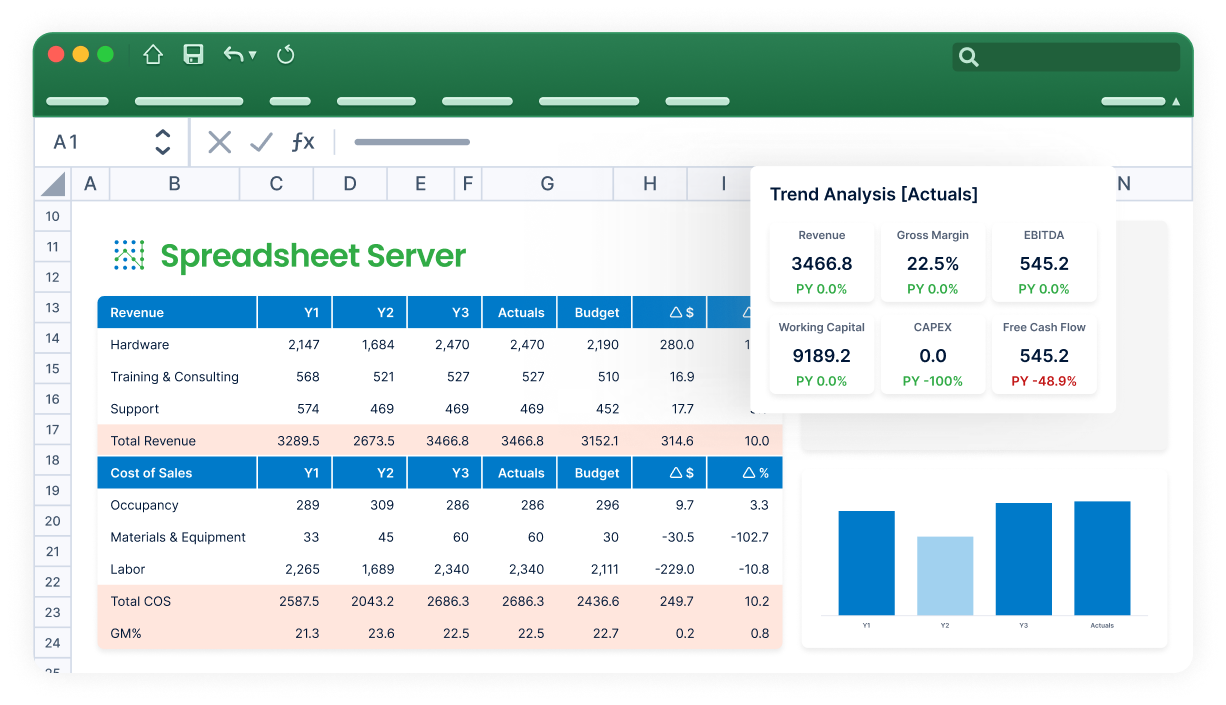
Spreadsheet Server is easy to install and delivers fast time to value. It automates custom reports with drill-down to transactional data.
Tidemark
Continuous and extended financial planning software for your enterprise.
Wands
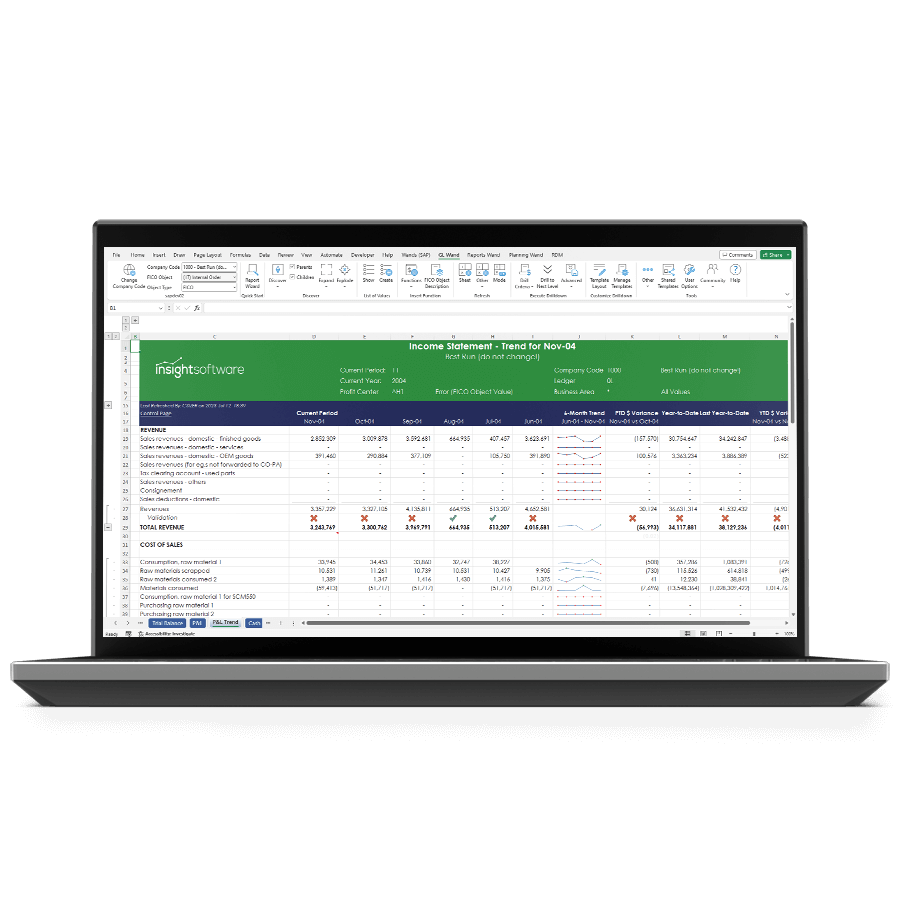
Real-time financial and custom business reporting directly in Excel for EBS and SAP.
Inefficiencies Hold Your Financial Analytics Dashboards Back

Static, Text-Heavy Reports
Even when you’re a seasoned CFO, traditional raw, tabular reports are hard to consume. The data takes time to interpret and analyze, which is the last thing your C-suite needs to worry about when facing a decision that will impact the business.

Financial Resource Burnout
Finance has become a go-to service for anyone who needs strategic or budgetary information. But when financial reports aren’t readable or digestible by non-technical users and teammates, you have to spend extra time on formatting, increasing the risk of frustration and burnout.

Inaccurate Report Sharing
Manually sharing data is error-prone and takes time away from critical analysis. Without the ability to instantly distribute accurate reports at the click of a button, you’re wasting valuable financial resources on administrative tasks that should be automated.
Financial Dashboard Software to Continuously Track Important Metrics & Performance
Track Performance Metrics Instantly
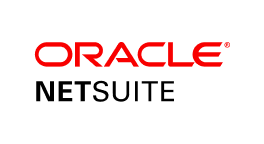
Gain immediate visibility into important KPIs like revenue, expenses, and profitability. With real-time data updates, you’re able to monitor performance trends, identify outliers, and make informed decisions swiftly. Whether tracking departmental performance or overall company health, stay agile and responsive with up-to-the-minute insights from our advanced financial dashboard platforms like Wands for Oracle, Wands for SAP, and Jet Reports.
Get Instant DemoReduction in reporting time
Accuracy in financial data
Increase in decision-making speed
Empower Executives With Actionable Data
Provide executives with intuitive dashboards that showcase critical financial metrics and performance indicators at a glance. From revenue forecasts to budget variances, empower decision-makers to instantly assess the financial health of the organization. With customizable visualizations and drill-down capabilities, insightsoftware enables executives to delve deeper into the data that drives strategic initiatives and optimize resource allocation.
Get Instant DemoReduction in reporting time
Accuracy in financial data
Increase in decision-making speed
Ensure Regulatory Compliance Effortlessly
Simplify compliance monitoring and reporting processes by consolidating financial data from disparate systems into a single dashboard. insightsoftware allows you to monitor compliance with industry regulations, accounting standards, and internal policies in real time. Automatically generate audit-ready reports, track adherence to financial controls, and mitigate compliance risks more efficiently. Comprehensive visibility and automated alerts ensure transparency and accountability across the organization while reducing the burden on compliance teams.
Get Instant DemoReduction in reporting time
Accuracy in financial data
Increase in decision-making speed
Financial Dashboard Resources to Help
Join a webinar for finance trends, tools, and insights. Elevate your reporting with innovative features, gain strategic perspectives, and stay ahead in finance.

Financial Dashboard FAQs
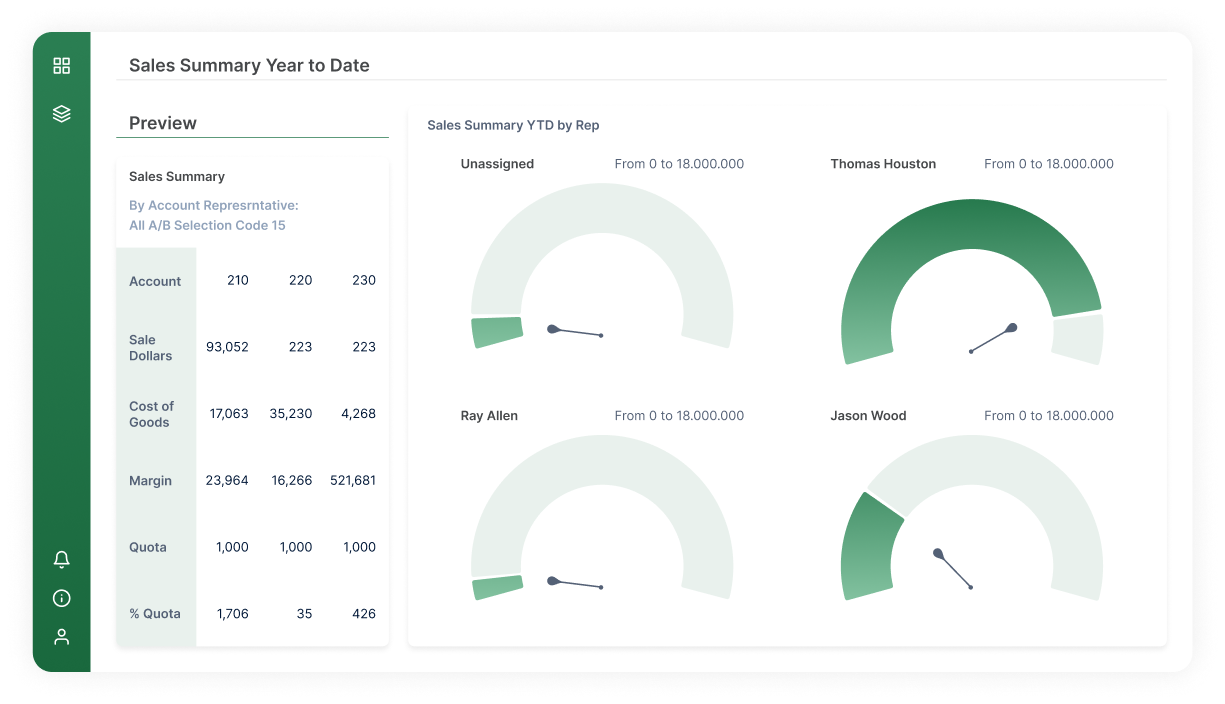
Before we get into the core of these tools, let’s set the foundation. Financial analytics dashboards are visual interfaces that offer real-time summaries of financial KPIs such as revenue, expenses, cash flow, gross profit margin, and return on sales. These dashboards typically utilize visualization techniques like charts, tables, and indicators that make it easy to quickly identify important insights. For example, insightsoftware financial dashboard tools aggregate data from your ERP, spreadsheets, budgeting tools, forecasting systems, and more to unify all of this information in one place for faster, more informed decision-making.
Because financial dashboards can include so many different pieces of data from different sources, it’s critical to stick to the most important metrics. Our experts recommend including core elements like high-level KPIs (revenue vs. budget, EBITDA margin, etc.), period-over-period trends, and forecasts vs. actuals. On top of these visualizations, it can be helpful to include drill-down functionality to dive deeper into data, as well as customizable views tailored to certain roles or product lines.
Out of the box, Excel has difficulties creating effective financial dashboards because it isn’t designed for real-time data updates and can slow down with large datasets. Limited automation and collaboration functionality further restrict your ability to make useful financial dashboards. However, insightsoftware platforms like Wands for Oracle/SAP, Spreadsheet Server, Jet Reports, and more have revolutionized this. These tools can connect directly to your ERP, data warehouses, and planning systems — and update these numbers directly within Excel. They also provide libraries of pre-built dashboard templates and functions so you don’t have to start from scratch, with dynamic charts and tables that you can refresh with a single click. In other words, insightsoftware combines the familiarity of Excel with our automation and advanced reporting capabilities to upgrade your financial dashboards.
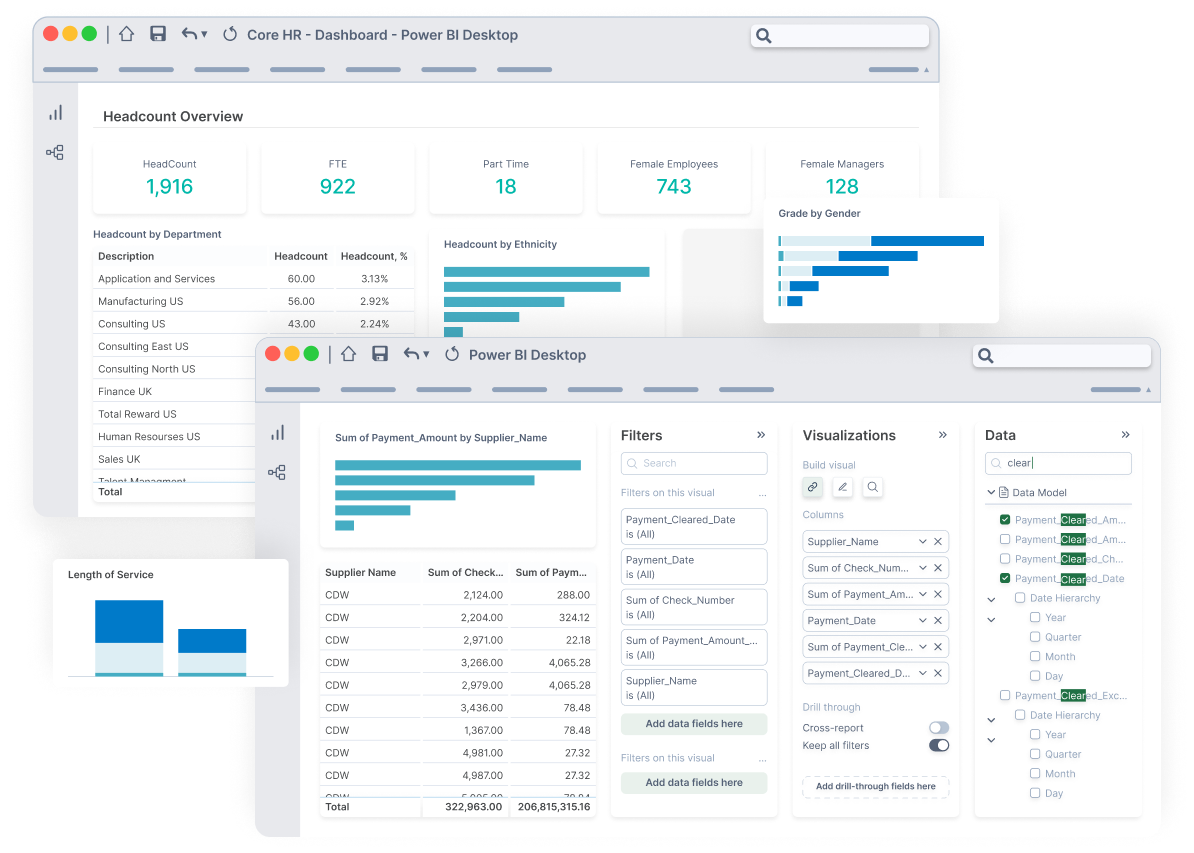
Power BI is more suited to create financial dashboards than Excel. Start by gathering your financial data, such as spreadsheets, accounting software, databases, and cloud services. You’ll then need to clean and transform your data (handle missing values, create calculated columns, etc.) so it can be visualized, before setting up data models and relationships. This might include defining relationships between tables, connecting related columns, and more. After all of this, you’re ready to design the actual dashboard and create visualizations (see our in-depth guide to dashboard design here).
However, adding interactivity, drill-through functionality, data quality validation, real-time updates, and more can be difficult with Power BI’s rigid limitations. This is where platforms like Power ON come in handy for real-time Power BI write-back. Power ON enables faster edits within your BI dashboards for more efficient planning and scenario modeling. For those using Oracle EBS, SAP ECC, or S/4HANA data with Power BI, Wands for Oracle and Wands for SAP further enhance your financial dashboards by simplifying data extraction and custom report creation so you can focus more on analysis and less on tedious manual exports.
When presenting these dashboards, our financial analysis experts recommend tailoring them to specific audiences. It helps to have certain views that serve as executive summaries, and others that get more into the weeds of operational data. You should also draw attention to certain areas of your dashboards using colors to highlight variances or other callouts. We always suggest incorporating interactive elements as well, so viewers can explore on their own and filter by department, region, time period, etc. Lastly, it’s important to tell a story with your data — when possible, try to logically group metrics and use visual cues to direct the narrative.
Thankfully, your financial dashboards don’t have to be manually updated or built. Automation and data governance are at the heart of insightsoftware platforms, including our financial dashboards. Tools like Wands for SAP and Wands for Oracle streamline data extraction and refreshes from your ERP systems, while also scheduling dashboard distribution (either time-based or event-triggered). Automated variance calculations and version control further enhance your budgeting and forecasting capabilities, revolutionizing processes that used to rely on manual exports and sluggish Excel formulas.
Automating your financial dashboards with insightsoftware comes with a variety of advantages:
- All your data is current and immediately up-to-date, which is critical for fast-paced sectors.
- Data accuracy improves as a result of eliminating copy-paste errors and manual data manipulation.
- Teams become more efficient because their time is freed up to analyze data instead of collecting and cleaning it.
- Quicker refreshes mean more flexible budget updates, reforecasting, and scenario modeling so your team can be more agile.
- Scaling is more feasible with automated workflows, pre-built templates, and more that extend financial dashboards across teams or geographies.
When evaluating modern financial dashboard software, look for features like:
- Live data connectivity across your systems
- Interactive drill-down (e.g. from summary to subledger)
- Customizable templates for different users/audiences
- Variance and trend analysis capabilities
- Embedded commentary for collaboration and narrative
- Mobile accessibility so users can use dashboards anywhere
While there are a lot of no-code financial dashboard tools on the market, many sacrifice functionality for the sake of simplicity. insightsoftware platforms like Wands, Jet Reports, and Spreadsheet Server combine Excel’s intuitive interface with deep utility for rich, interactive, and shareable financial dashboards. For those looking to embed dashboards and analytics within other applications, Logi Symphony easily accomplishes this with drag-and-drop editors, no coding required. Other options like Qlik or Tableau offer no-code dashboard creation, but these usually don’t include the strong ERP integrations that insightsoftware tools are built with, and lack the advanced visualizations or financial-specific logic that our platforms provide out of the box.
Many general business intelligence tools like Power BI are popular for financial dashboard creation, but often lack the customization or interactive elements that purpose-built dashboard solutions include. Excel-based tools like Jet Reports can add slicers, pivot-like drill-downs, and other interactive chart features. Spreadsheet Server and our Wands platforms also integrate with Excel and your ERP to create real-time dashboards that use interactive Excel tools like formulas, tables, filters, conditional formatting, and more. Logi Symphony goes a step further to embed interactive dashboards within other applications for AI-enhanced self-service capabilities — no extensive coding required.
insightsoftware offers a range of financial dashboards, including ones for financial reporting, budgeting, forecasting, and analytics. With our tools, you can create strategic or executive dashboards (CXO), analytical dashboards (Spreadsheet Server, Wands for SAP/Oracle, Jet Reports), operational dashboards (Power ON, Jet Analytics), and budgeting/forecasting dashboards (Bizview, Longview Plan, Hubble).
Yes. insightsoftware’s dashboards are highly customizable, allowing you to tailor them to your organization’s unique requirements and preferences. You can then save the customized version as a new template to re-use in the future.
Very easy. insightsoftware’s solutions are designed to seamlessly integrate with various data sources, including more than 200 ERPs, cloud systems, data warehouses, spreadsheets, and other sources. Our pre-built connectors make setup even easier, and preconfigured workflows make refreshing your data a breeze.
Yes. insightsoftware’s dashboards are accessible on mobile devices through web browsers or dedicated mobile apps, providing flexibility for users on the go.
Our financial dashboard tools (Wands, Spreadsheet Server, and Jet Reports) come with a variety of features and characteristics that make them stand out. Instead of master-of-none BI tools that happen to include basic dashboarding capabilities, our platforms are built from the ground up to be the best financial dashboard solutions available. Not only that, but they’re designed specifically with finance teams in mind, offering compliant templates to get dashboard creation off the ground faster. Our deep integrations across ERP systems like Oracle EBS, SAP S/4HANA, Dynamics 365, NetSuite, and more all enable finance professionals to analyze real-time data like never before. This doesn’t stop at the KPI level, though — our dashboards include drill-down capabilities to go beyond the surface-level analytics and identify the source of change. Lastly, our scalable architecture is unmatched, enabling large dataset manipulation in Excel without crippling performance and responsiveness.
insightsoftware provides comprehensive support and training resources, including documentation, tutorials, webinars, and customer support channels, to help users effectively utilize their financial dashboards. We also offer onboarding and implementation services tailored to your ERP stack, 24/7 global support with offices worldwide, as well as template libraries and best-practice playbooks.