Visual Analytics Tools for Enhanced Decision-Making & Interactive Data Exploration
insightsoftware solutions (Logi Symphony, Vizlib, and JustPerform) enhance your visual analytics capabilities to bring data exploration, operational optimization, market understanding, and more into the 21st century. Powered by advanced AI systems like Lineos and Logi AI, insightsoftware transforms enterprise visual analytics suites into cutting-edge ecosystems that give businesses across the globe competitive advantages to stay ahead of the rest of their industry.
Are Your Current Reports Static and Difficult to Read? Visual Analytics Tools Can Help.
Every Financial Report Looks the Same
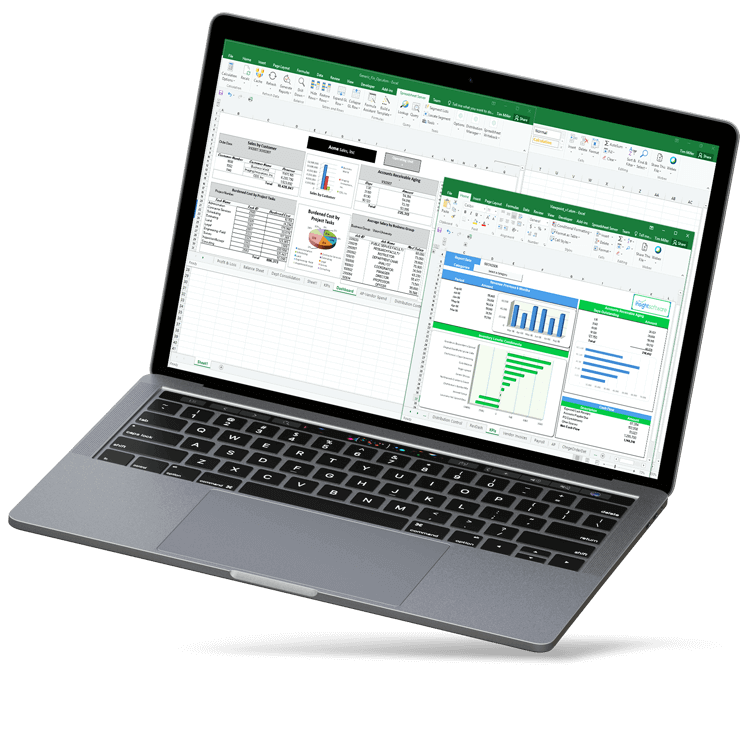
When every report has the same boring layout with raw data in static rows and columns, it can be hard to interpret the results on the fly, and even harder to base your decisions on them. Logi Symphony brings your reports to life with interactive and customizable data visualizations to communicate meaning and make it easier to act on insights.
You Need Better Visibility into Your Data
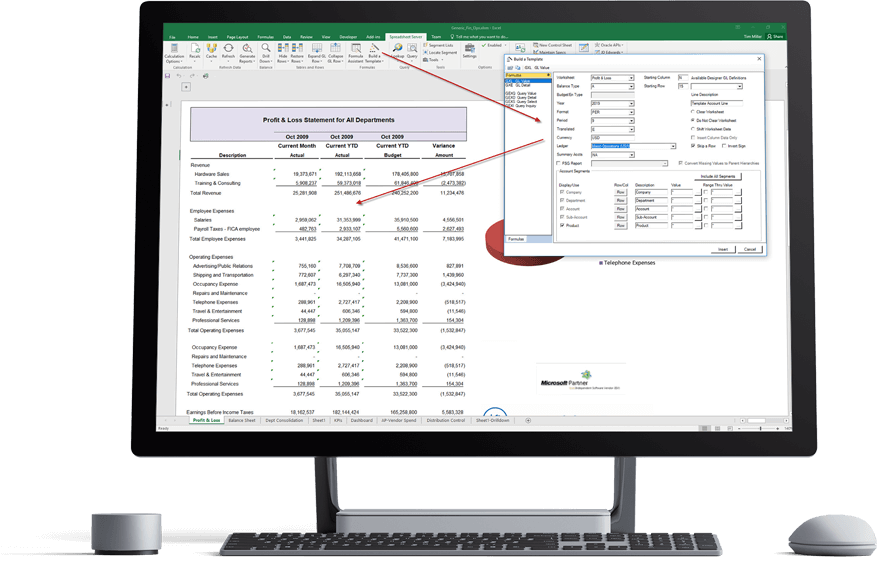
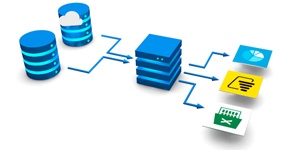
ERPs are designed to collect data, not to visualize or report on it. Formatting data from thousands of tables in a consumable way is not an easy task for most users. JustPerform connects directly to your ERP and financial systems to provide a unified (and governed) hub of data visibility for instant self-service financial and operational reporting.
You Rely on Others to Build and Modify Reports
Without the technical skills to update reports or formatting for readability, you’re forced to wait on IT for all change requests. Vizlib restores your team’s agility by offering easy-to-use drag-and-drop analytics directly within Qlik, so non-technical users can create and modify dashboards without coding for faster iteration and reduced IT backlog.
Benefits of insightsoftware Visual Analytics Tools for Businesses
Get Access to the Data You Need From Day One
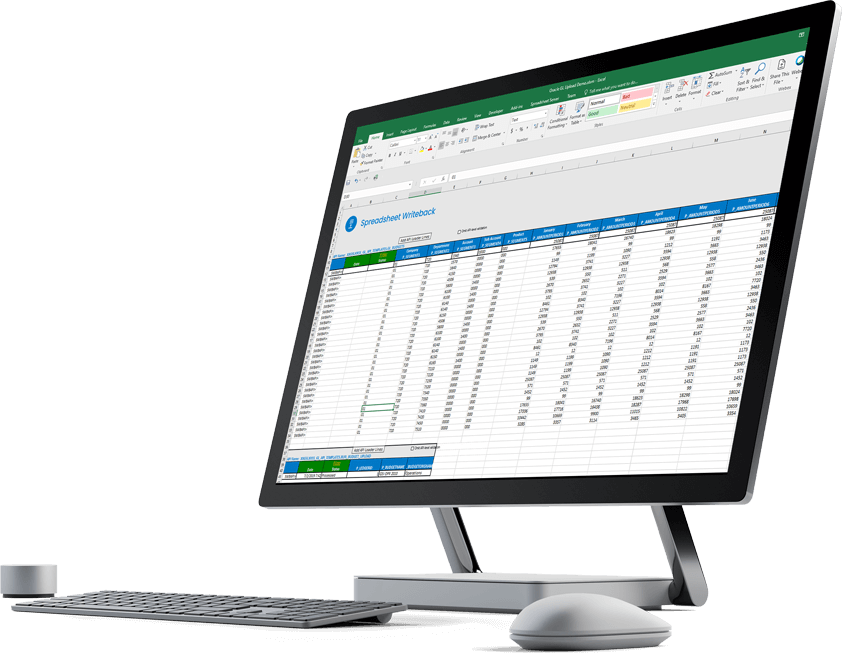
With pre-built report templates, you can run reports in seconds or tailor them in minutes to fit your business needs. Create ad hoc inquiries, reports, and web dashboards against any ERP module without IT help. Drill from summary to balances, journals, and sub-ledgers in real time to investigate variances and to find and fix issues fast.
Create and Share Compelling Data Visualizations
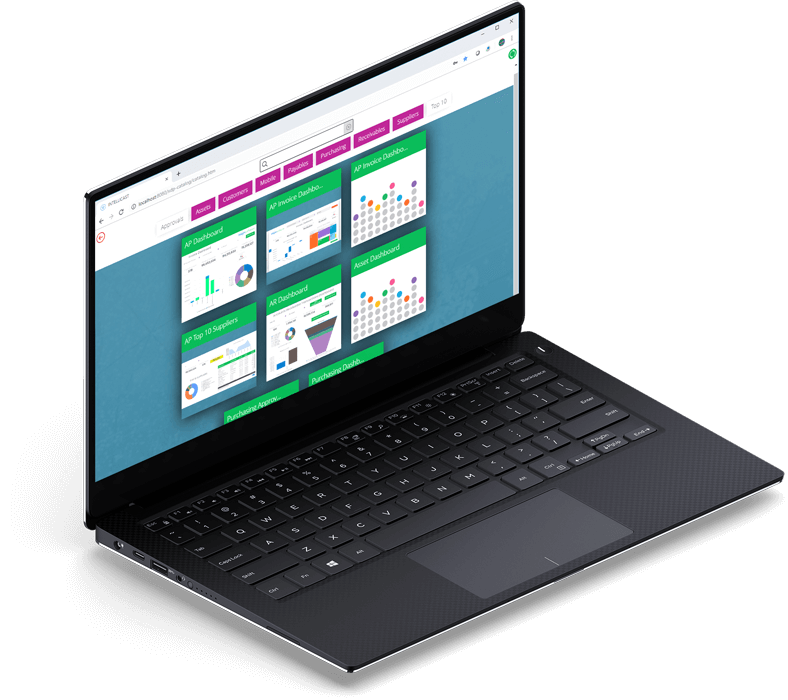
Bring all your critical metrics into focus in one place using easy-to-consume, real-time web dashboards to display beautiful visualizations. Users across your organization can then monitor KPIs, analyze trends, collaborate through discussions, and drill into underlying ERP transactions.
Introduce a Governed Reporting Process
Reduce risk and help with compliance in regulated industries or where required by auditors. A host of controls (including full integration with ERP and EPM security, read-only data in reports, workflows, and approvals) and different user types govern access to functionality and provide a complete audit trail.
Integrates with:
- Oracle E-Business Suite (EBS)
- Oracle EPM Cloud
- Oracle ERP Cloud
- Oracle Essbase
- Oracle Financial Consolidation and Close (FCCS)
- Oracle Fusion
- Oracle Hyperion Enterprise
- Oracle Hyperion Financial Management (HFM)
- Oracle Hyperion Planning
- Oracle PeopleSoft
- Oracle Planning and Budgeting Cloud Service (PBCS)
- Oracle Tax Reporting

- Dynamics 365 Business Central
- Dynamics 365 Finance and Supply Chain Management
- Dynamics AX
- Dynamics CRM
- Dynamics GP
- Dynamics NAV
- Dynamics NAV C5
- Dynamics SL
- SQL Server Analysis Services (SSAS)

- Deltek Ajera
- Deltek Maconomy
- Deltek VantagePoint
- Deltek Vision
- Deltek Vision Cloud
- Viewpoint Spectrum
- Viewpoint Vista
- MRI Commercial Management
- MRI Financials
- MRI Horizon
- MRI Horizon CRE
- MRI Qube Horizon
- MRI Residential Management
- Epicor Avante
- Epicor BisTrack
- Epicor CMS
- Epicor Enterprise
- Epicor Epicor SLS
- Epicor iScala
- Epicor Kinetic
- Epicor LumberTrack
- Epicor Manage 2000
- Epicor Prophet 21
- Epicor Tropos

- Infor CloudSuite Financials
- Infor Distribution SX.e
- Infor Financials & Supply Management
- Infor Lawson
- Infor M3
- Infor System21
- Infor SyteLine
- Infor XL
- Sage 100
- Sage 100 Contractor
- Sage 200
- Sage 300
- Sage 300 CRE (Timberline)
- Sage 500
- Sage 50cloud Accounting
- Sage AccPac
- Sage Adonix Tolas
- Sage Estimating
- Sage Intacct
- Sage MAS
- Sage X3
- 24SevenOffice
- A+
- AARO
- AccountEdge
- Accounting CS
- Accountmate
- Acumatica
- Alere
- Anaplan
- Aptean
- Assist
- ASW
- Aurora (Sys21)
- Axion
- Axis
- BAAN
- Banner
- Blackbaud
- BlueLink
- Book Works
- BPCS
- Cayenta
- CCH
- CDK Global
- CedAr e-financials
- CGI Advantage
- Clarus
- CMiC
- CMS (Solarsoft)
- Coda
- Coins
- Colleague
- CPSI
- CSC CorpTax
- Custom
- CYMA
- DAC
- Data Warehouse
- Datatel
- DATEV
- Davisware Global Edge
- Davisware S2K
- Deacom
- DPN
- e5
- eCMS
- Eden (Tyler Tech)
- Emphasys
- Entrata
- Etail
- Expandable
- FAMIS
- Famous Software
- Fern
- FinancialForce
- FireStream
- FIS
- FiServ
- Flexi
- Fortnox
- Foundation
- Fourth Shift
- Friedman
- Full Circle
- GEMS
- Harris Data (AS/400)
- HCS
- HMS
- IBM Cognos TM1
- IBS
- IBS-DW
- In-House Developed
- Incode
- INFINIUM
- IQMS
- iSuite
- Jack Henry
- Jenzabar
- JobBOSS
- Jonas Construction
- M1
- Macola
- MACPAC
- Made2Manage
- MAM
- MAM Autopart
- Manman
- Mapics
- McLeod
- MEDITECH
- MFG Pro
- MicrosOpera
- MIP
- Mitchell Humphrey
- Movex
- MRI
- MSGovern
- Munis (Tyler Tech)
- New World Systems
- Onesite
- Onestream XF
- Open Systems
- PDI
- Penta
- Plexxis
- PowerOffice
- PRMS
- Pro Contractor
- ProLaw
- Q360
- QAD
- Quantum
- Qube Horizon
- QuickBooks Desktop Premier
- QuickBooks Desktop Pro
- Quickbooks Enterprise
- QuickBooks Online
- Quorum
- RealPage
- REST API
- Retalix
- Ross
- SmartStream
- Spokane
- Springbrook
- Standalone DB with ODBC/DSN connection
- Standalone IBM DB
- Standalone Oracle DB
- Standalone SQL DB
- SUN
- Sunguard
- SunSystems
- Sys21
- SyteLine
- TAM (Applied Systems)
- Thomson Reuters Tax
- Timberline
- TIMELINE
- Traverse
- TripleTex
- Unit4
- Unit4 Agresso
- Unit4 Business World
- Unit4 Coda
- USL Financials
- Vadim
- VAI-System 2000
- Vantage
- Vertex
- Visma
- Winshuttle
- Wolters Kluwer CCH Tagetik
- WorkDay
- Xero
- xLedger
- Xperia
- Yardi
- Yardi-SaaS

Webinar: Advanced Data Visualizations with Logi Symphony
Traditional BI dashboards can only take you so far, especially in the age of AI. In order to uncover deeper insights and drive real data understanding, analytics needs to go beyond informing users and actually engage them. In this on-demand webinar, we explore ten advanced visual analytics methods that are available in Logi Symphony.
See for yourself how Logi Symphony builds highly interactive and customizable visualizations that you can embed in other systems for deeper (and more accessible) insights. Confident business decisions rely on distilling meaningful understanding and takeaways from raw data, which traditional ERPs and systems can’t keep up with. See how Logi Symphony and insightsoftware’s visual analytics tools can redefine how your business communicates data and makes data-driven decisions.
Work with the #1 Financial Reporting Vendor for ERPs and EPMs

“People are able to make better decisions faster with Jet Analytics. We’ve gotten that feedback as we circle back to every phase, from sales to procurement to inventory—we had no easy visibility into those numbers.”
Speak to an Expert